Make the most out of our reporting functionality
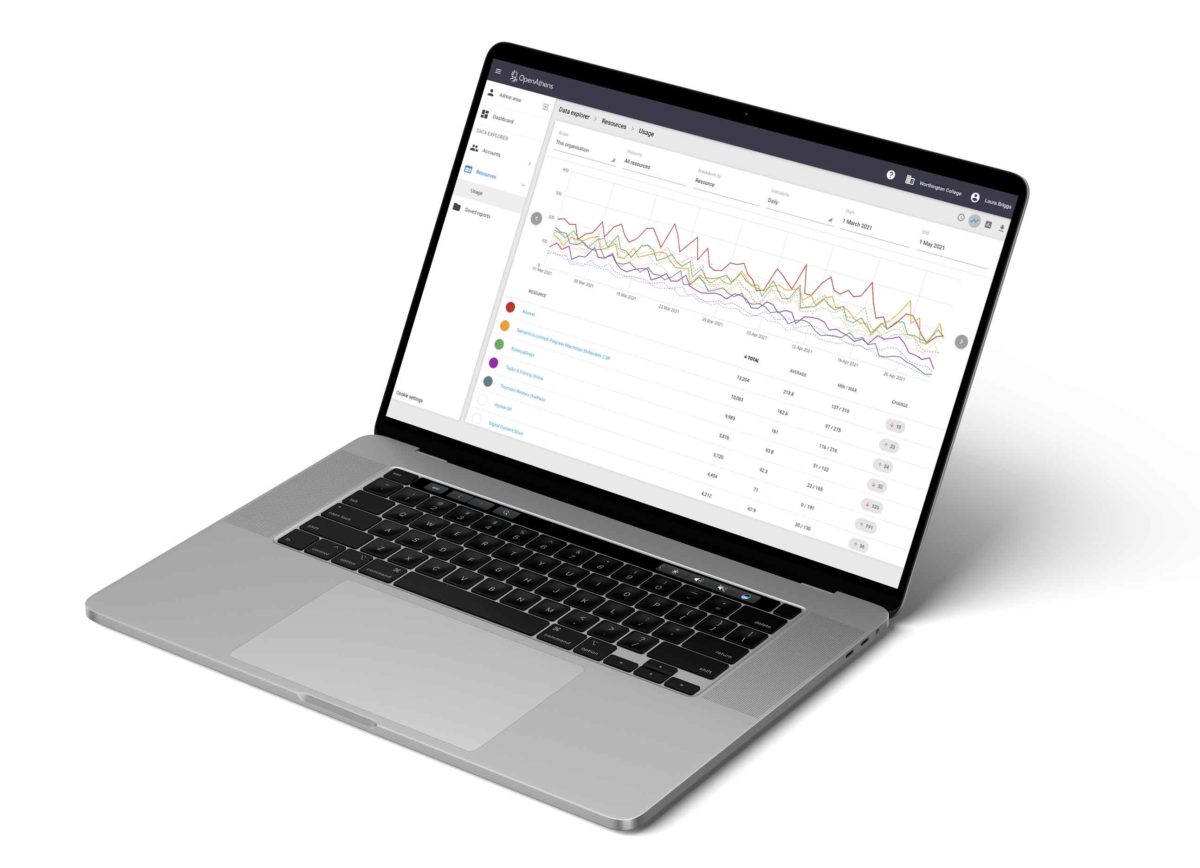
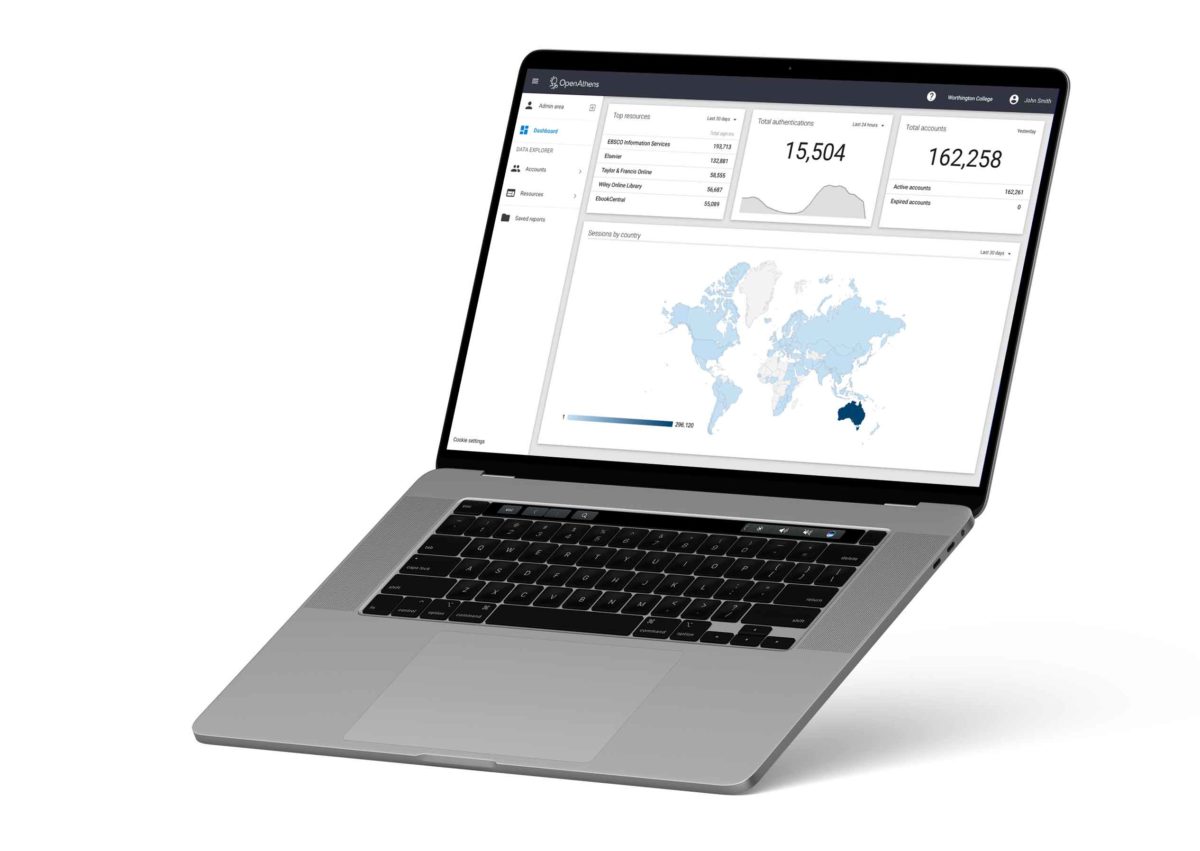
We know how important reporting is to libraries in order to track usage and monitor access. The reports are available with enhanced visual graphics rather than being purely text-based – this makes them easier to understand by a range of internal audiences.
We recommend spending some time looking through and planning what reports will be of most use to your organization. For example, reports can be generated showing hot zones – times when more people are likely to be accessing content and this can help influence staffing decisions within libraries to ensure you have enough people resource in place.
To make the most of the library reporting options, your accounts should include all the relevant information you want to report on – there are several options, see: Making the most of the reporting functions.
There are two key report types:
Account reports
These cover account types, authentication totals, account locations and any custom elements you wish to track.
Resource access reports
These look at what resources authenticated users are accessing and can be broken down into any attributes you wish to track such as departmental usage so you can identify where further help or guidance may be required to encourage greater access.
The report interface, the Data Explorer, enables you to define what reports you want and which attributes you’d like to be included within these reports such as timescale, measurement units, groupings and more.
Discover our new Reporting API
Our Reporting API add-on is a time-saving tool created with librarians at heart. It offers data granularity to suit your needs, helping you understand users, improve retention and manage your budget.
Any report can be saved or scheduled
Library reporting tool demo
To make the most of the reporting options available, you must customize your reports to suit your needs. This means you must ensure that your user accounts include all the relevant information that you wish to track or measure against in your reports.
Check out our library reporting playlist
We have created a playlist containing educational video resources about our reporting tool and our reporting API on our YouTube channel.


